How to Read & Interpret Charts – Fassi Cranes

THE GRAPHICS AND VALUES EXPRESSED IN FASSI CRANE LIFTING CAPACITY CHARTS ARE A FURTHER REASON FOR COHERENCE, BECAUSE ON THE MARKET SOME CHARTS ARE BETTER THAN OTHERS
HOW TO READ A LIFTING CHART
The lifting capacity chart expresses the potential of a crane: the load size that it can lift according to the distance. Being able to read a lifting capacity chart properly means that, when evaluating purchase, you will have a proper knowledge of how much this crane can actually do.
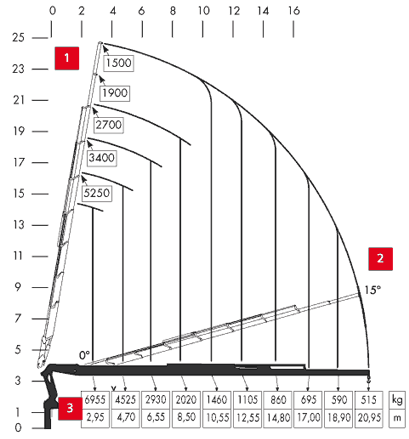
In the diagram published below we have summarized the meanings of the different elements present in a Fassi lifting capacity chart, outlining the main points for a correct reading. As you will see, the indications aim to provide the most precise and truthful information on the real dynamic load performance, that is to say the direct ratio between liftable load and the distance from the crane column.
ATTENTION! ALWAYS EXPECT MAXIMUM CLARITY IN THE INFORMATION PROVIDED
Fassi lifting capacity charts indicate dynamic values: the nominal loads are liftable at any point of the diagram and the reaches take into consideration deformation of the crane structure. However, the fact that on the market there are other graphic and numeric models used to represent capacity data may generate misunderstandings and confusion. These documents, instead of referring to dynamic load performance, express static load performance, that is to say not related to actual lifting capacity.
Static curves express the positions at which the lifting moment limiting device is triggered, so that the points in the curves are only reached by load extension (translation) and not by lifting! Indicating a static curve its possible to show values 10% higher than what the same crane model can actually lift in dynamic conditions. What appears to be an advantage is however in reality a limit, although this is only indicated in the use and maintenance manuals. It is therefore very important to evaluate information regarding crane performance at the time of purchase, asking the seller to declare, ideally in writing, the capacity conditions.

- Maximum vertical load values.
- Maximum working angle with ProLink.
- Squares with indications of the maximum liftable weight at the corresponding distance from the centre column. Recordings for the ratio load/distance are taken in the typical lifting conditions
FASSI TECHNOLOGY MAKES THE MOST OF REACH DURING LIFTING
What is the advantage of a 0° inner boom angle?
It means you are making the most of the hydraulic reach in lifting curves, instead of having to angle the inner boom, causing a reduction in the maximum hydraulic reach.
FASSI LIFTING CHARTS SHOW EXACTLY WHAT IT’S POSSIBLE TO DO
What is the advantage of a clear lifting capacity chart?
A chart that clearly and truthfulness indicates the dynamic lifting data allows an understanding of the real lifting potentialities of the crane.
What does publication of certain information actually mean?
It means pursuit of a company politics of reliability and good practice towards purchasers and users.
WHY HAS FASSI CHOSEN A DYNAMIC CURVE RATHER THAN A STATIC ONE?
What is a dynamic lifting curve?
It is a curve expressing the actual lifting performance, that is to say the ratio between the load that can be lifted and the distance from the crane column.
What is a static lifting curve?
It is a curve expressing the positions in which the lifting moment limiting device is activated, that is to say the points in the curves are only reached by extension and not by lifting.
WHAT TO DO WHEN EVALUATING PURCHASE OF A CRANE
- Ask to the dealer if the lifting capacity chart is static or dynamic. In any case ask for a practical lifting test, checking that the crane actually meets the indications on the lifting capacity chart.
- During the test, make sure that the crane is prepared for normal working conditions with all the due and necessary safety devices turned on.
